


Trusted by over 15 Million Traders
The Most Awarded Broker
for a Reason
Easy Access to 1,400+ Global Assets
EURUSD
Euro vs U.S. Dollar
US500
S&P 500 (US500)
GOLD
Gold
COFFEE
US Coffee
Apple
Apple (AAPL.OQ)
-

Finance Magnates 颁发
-

Finance Magnates 颁发
-

Capital Finance International Magazine (CFI.co) 2024年颁赠
-

COLWMA 2024年颁赠
-

荣获World Finance Forex Awards 2023最佳外汇客户服务奖
-

荣获World Finance Forex Awards 2023欧洲最佳外汇经纪商奖
-

荣获World Finance Forex Awards 2023澳大拉西亚最佳外汇经纪商奖
-

荣获World Finance Forex Awards 2023拉丁美洲最佳外汇经纪商奖
-

荣获World Finance Forex Awards 2023中东最佳外汇经纪商奖
-

CFI.co于2023年颁赠
-

荣获2023年City of London Wealth Management Awards
-

荣获2022年埃及金融博览会颁赠
-

荣获2022年City of London Wealth Management Awards
-

CFI.co于2022年颁赠
-

荣获Global Forex Awards 2022 — 零售外汇 颁赠
-
2021年迪拜外汇博览会获颁赠
-

Ultimate Fintech 2021年颁赠
-

荣获2021年City of London Wealth Management Awards
-

FX168于2020年12月颁赠
-

荣获Global Business Awards 2020
-

荣获2020年City of London Wealth Management Awards
-

Capital Finance International Magazine (CFI.co)颁赠
-

Capital Finance International Magazine (CFI.co)颁赠
-

荣获2019年City of London Wealth Management Awards
-

Shares Magazine 授予 UK Forex Awards 2018
-

Capital Finance International Magazine (CFI.co)颁赠
-

Capital Finance International Magazine (CFI.co)颁赠
-

2017年伦敦财富管理奖
-

2016最佳本土 客户服务
-

中东和北非地区(MENA)增长最快的经纪商
-
2015年最佳外汇科技提供商
-
2014年最佳外汇科技提供商
-

2014年最佳外汇科技提供商
-

荣获 The Trading Show 2024年非洲 Africa Fintech 峰会颁赠
-

荣获2024年中东地区 Brokersview 颁赠
-
荣获2024年中东地区 Brokersview 颁赠
-

荣获2024年阿曼 Smart Vision 峰会颁赠
-

荣获2024年迪拜外汇博览会颁赠
-

荣获2024年迪拜 Forex Traders Summit 颁赠
-

2024年埃及 Smart Vision 峰会颁赠
-

投查查于2024年颁赠
-

Capital Finance International Magazine (CFI.co) 2024年颁赠
-

CFI.co于2023年颁赠
-

CFI.co于2023年颁赠
-

交易社区平台FOLLOWME于2022年颁赠
-
2022年迪拜Forex Expo获颁赠
-
2022年迪拜Forex Expo获颁赠
-

荣获Global Forex Awards 2022 — 零售外汇 颁赠
-

CFI.co于2022年颁赠
-

CFI.co于2022年颁赠
-

World Finance Forex Awards 2022 颁发
-

World Finance Forex Awards 2022 颁发
-

World Finance Forex Awards 2022 颁发
-

World Finance Forex Awards 2022 颁发
-
交易社区平台FOLLOWME于2021年颁赠
-

2021年埃及Smart Vision Investment Expo博览会获颁赠
-

CFI.co于2021年颁赠
-

CFI.co于2021年颁赠
-

荣获Global Forex Awards 2021 — 零售外汇 颁赠
-

荣获Global Forex Awards 2021 — 零售外汇 颁赠
-

World Finance 2021颁发
-

World Finance 2021颁发
-
FOLLOWME于2021年颁赠
-

Global Forex Awards 2021 — B2B 颁赠
-

Global Forex Awards颁赠
-

Global Forex Awards颁赠
-

CFI.co于2020年颁赠
-

CFI.co于2020年颁赠
-

荣获Global Business Awards 2020
-

World Finance Magazine 颁赠
World Finance Forex Awards 2020 -

World Finance Magazine 颁赠
World Finance Forex Awards 2020 -
FOLLOWME交易社区授予
-

Global Forex Awards颁赠
-

Global Forex Awards颁赠
-

FinTech Age Awards颁发
-

World Finance Magazine 颁赠
World Finance Forex Awards 2019 -

World Finance Magazine 颁赠
World Finance Forex Awards 2019 -

荣获 World Finance Forex Awards 2018 颁赠
-

荣获2018年埃及金融博览会颁赠
-

荣获 Shares Magazine 的 UK Forex Awards 2017 颁赠
-

荣获 World Finance Forex Awards 2017
-

2016年最佳黄金经纪商
-

2016年最佳外汇经纪商
-

2015年最佳本地客户服务
-

Global Brands Magazine 颁赠
-

Online Money Awards 2022 颁发
-

荣获2022年埃及金融博览会颁赠
-

2015最佳外汇交易平台
-

2015最佳金融交易平台
-

2013最佳创新外汇平台奖
-

2020年 Cyprus HR Awards 颁赠
-

金融行业的佼佼者
-

认证最优金牌级别
-

2014年首届亚军
-
Finance Magnates 颁发
-
Finance Magnates 颁发
-
Capital Finance International Magazine (CFI.co) 2024年颁赠
-
COLWMA 2024年颁赠
-
荣获World Finance Forex Awards 2023最佳外汇客户服务奖
-
荣获World Finance Forex Awards 2023欧洲最佳外汇经纪商奖
-
荣获World Finance Forex Awards 2023澳大拉西亚最佳外汇经纪商奖
-
荣获World Finance Forex Awards 2023拉丁美洲最佳外汇经纪商奖
-
荣获World Finance Forex Awards 2023中东最佳外汇经纪商奖
-
CFI.co于2023年颁赠
-
荣获2023年City of London Wealth Management Awards
-
荣获2022年埃及金融博览会颁赠
-
荣获2022年City of London Wealth Management Awards
-
CFI.co于2022年颁赠
-
荣获Global Forex Awards 2022 — 零售外汇 颁赠
-
2021年迪拜外汇博览会获颁赠
-
Ultimate Fintech 2021年颁赠
-
荣获2021年City of London Wealth Management Awards
-
FX168于2020年12月颁赠
-
荣获Global Business Awards 2020
-
荣获2020年City of London Wealth Management Awards
-
Capital Finance International Magazine (CFI.co)颁赠
-
Capital Finance International Magazine (CFI.co)颁赠
-
荣获2019年City of London Wealth Management Awards
-
Shares Magazine 授予 UK Forex Awards 2018
-
Capital Finance International Magazine (CFI.co)颁赠
-
Capital Finance International Magazine (CFI.co)颁赠
-
2017年伦敦财富管理奖
-
2016最佳本土 客户服务
-
中东和北非地区(MENA)增长最快的经纪商
-
2015年最佳外汇科技提供商
-
2014年最佳外汇科技提供商
-
2014年最佳外汇科技提供商
-
荣获 The Trading Show 2024年非洲 Africa Fintech 峰会颁赠
-
荣获2024年中东地区 Brokersview 颁赠
-
荣获2024年中东地区 Brokersview 颁赠
-
荣获2024年阿曼 Smart Vision 峰会颁赠
-
荣获2024年迪拜外汇博览会颁赠
-
荣获2024年迪拜 Forex Traders Summit 颁赠
-
2024年埃及 Smart Vision 峰会颁赠
-
投查查于2024年颁赠
-
Capital Finance International Magazine (CFI.co) 2024年颁赠
-
CFI.co于2023年颁赠
-
CFI.co于2023年颁赠
-
交易社区平台FOLLOWME于2022年颁赠
-
2022年迪拜Forex Expo获颁赠
-
2022年迪拜Forex Expo获颁赠
-
荣获Global Forex Awards 2022 — 零售外汇 颁赠
-
CFI.co于2022年颁赠
-
CFI.co于2022年颁赠
-
World Finance Forex Awards 2022 颁发
-
World Finance Forex Awards 2022 颁发
-
World Finance Forex Awards 2022 颁发
-
World Finance Forex Awards 2022 颁发
-
交易社区平台FOLLOWME于2021年颁赠
-
2021年埃及Smart Vision Investment Expo博览会获颁赠
-
CFI.co于2021年颁赠
-
CFI.co于2021年颁赠
-
荣获Global Forex Awards 2021 — 零售外汇 颁赠
-
荣获Global Forex Awards 2021 — 零售外汇 颁赠
-
World Finance 2021颁发
-
World Finance 2021颁发
-
FOLLOWME于2021年颁赠
-
Global Forex Awards 2021 — B2B 颁赠
-
Global Forex Awards颁赠
-
Global Forex Awards颁赠
-
CFI.co于2020年颁赠
-
CFI.co于2020年颁赠
-
荣获Global Business Awards 2020
-
World Finance Magazine 颁赠
World Finance Forex Awards 2020 -
World Finance Magazine 颁赠
World Finance Forex Awards 2020 -
FOLLOWME交易社区授予
-
Global Forex Awards颁赠
-
Global Forex Awards颁赠
-
FinTech Age Awards颁发
-
World Finance Magazine 颁赠
World Finance Forex Awards 2019 -
World Finance Magazine 颁赠
World Finance Forex Awards 2019 -
荣获 World Finance Forex Awards 2018 颁赠
-
荣获2018年埃及金融博览会颁赠
-
荣获 Shares Magazine 的 UK Forex Awards 2017 颁赠
-
荣获 World Finance Forex Awards 2017
-
2016年最佳黄金经纪商
-
2016年最佳外汇经纪商
-
2015年最佳本地客户服务
-
Global Brands Magazine 颁赠
-
Online Money Awards 2022 颁发
-
荣获2022年埃及金融博览会颁赠
-
2015最佳外汇交易平台
-
2015最佳金融交易平台
-
2013最佳创新外汇平台奖
-
2020年 Cyprus HR Awards 颁赠
-
金融行业的佼佼者
-
认证最优金牌级别
-
2014年首届亚军

Awarded BestBrokerYear After Year
CATEGORIES
News
- Preparing for geopolitics and a dense Fed signal-intensive week
- Fed policy bets boost Australian dollar, U.S. economic data weak
- Tariffs in the United States and Japan may escalate, the Bank of Japan, the Fede
- The dollar index continues to fall, and Fed Daly predicts two interest rate cuts
- Practical foreign exchange strategy on August 20
market news
Weekly rebound is coming, gold and silver continue to go long
Wonderful Introduction:
A quiet path will always arouse a relaxed yearning in twists and turns; a huge wave, the thrilling sound can be even more stacked when the tide rises and falls; a story, only with regrets and sorrows can bring about a heart-wrenching desolation; a life, where the ups and downs show the stunning heroism.
Hello everyone, today XM Foreign Exchange will bring you "[XM Foreign Exchange]: Weekly rebound is xmh100.coming, and gold and silver continue to go long." Hope it will be helpful to you! The original content is as follows:
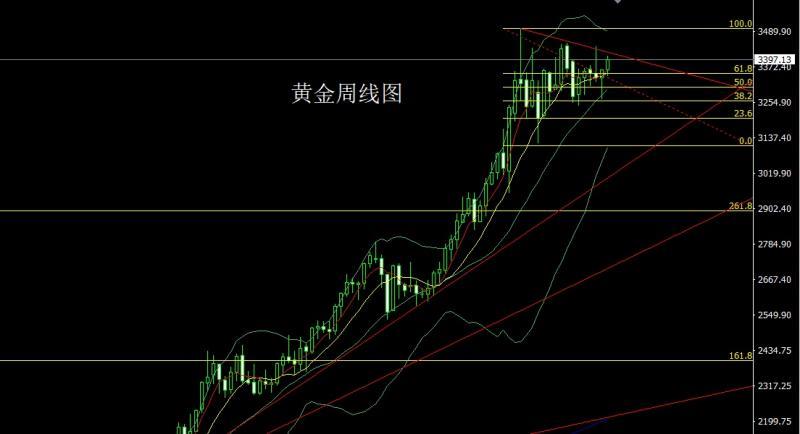
Last week, the gold market opened at the 3363.9 position and the market fell first. The weekly line was at the lowest point of 3344.4 and then the market fluctuated strongly. The weekly line reached the highest point of 3409.2 position and the market consolidated. The weekly line finally closed at the 3397.1 position. The weekly line closed with a medium-positive line with a lower shadow line longer than the upper shadow line. After this pattern ended, the market continued this week. Continue to be bullish on the technical demand, at the point, the stop loss followed by the long position reduction of 3372 and 3381 last Friday, holding at 3379. Today's market is 3384 long, conservative 3382 long stop loss 3379. The target above is 3397 and 3402 and 3406 pressures. If the above position breaks, the main pressure above is 3416 and 3424 pressures. If the above position breaks, the upper space opens to see a historical high
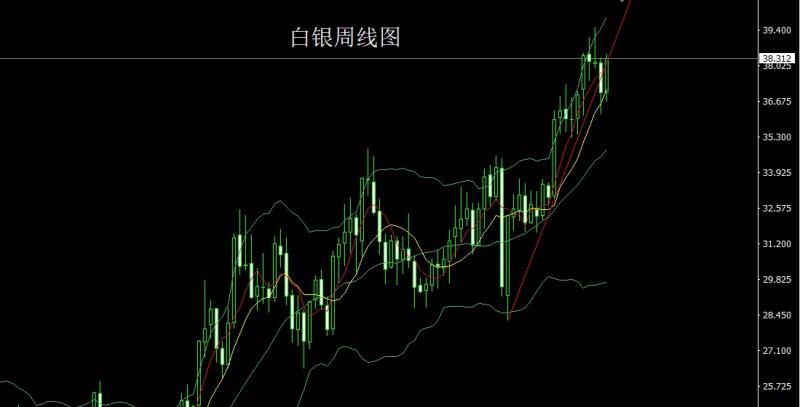
The silver market opened at 37.02 last week and then fell first. The weekly line was at the lowest point of 36.633 and then the market fluctuated strongly. The weekly line reached the highest point of 38.509 and then the market consolidated. After the weekly line finally closed at 38.312, the weekly line closed with a large positive line with a longer lower shadow line. After the weekly line level was positive and negative, the market continued to be low. At the point, the stop loss after reducing positions at 38.05 last Friday was followed by a stop loss of 37.9. Today, the target is 38.51 and 38.8and 39-39.5.
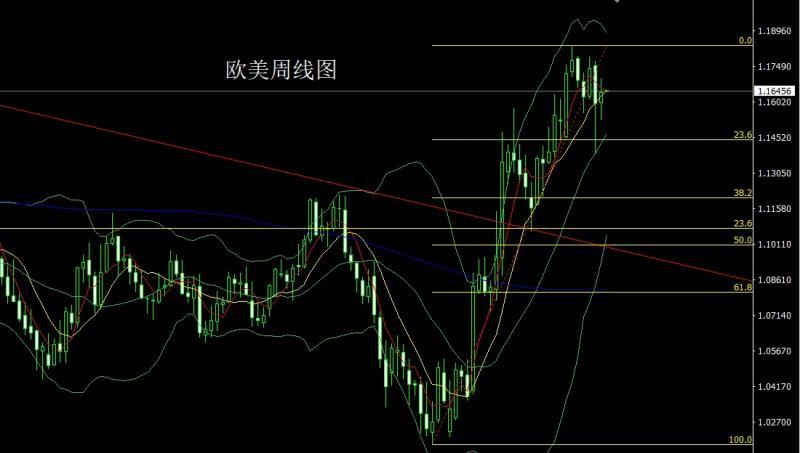
The European and American markets opened at 1.15999 last week and the market fell first. The weekly line was at the lowest point of 1.15257 and then the market rose strongly. The weekly line reached the highest point of 1.16994 and then the market consolidated. The weekly line finally closed at 1.16401 and then the market closed in a spindle pattern with a lower shadow slightly longer than the upper shadow. After this pattern ended, it fell back to 1.16200 and stop loss of 1.16000 today. The target is 1.16500 and 1.16700-1.16900.
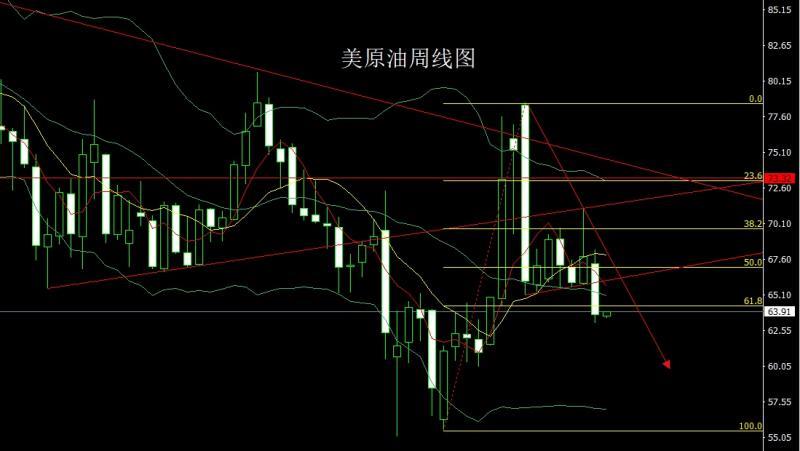
The US crude oil market opened lower last week at 67.3 and then the market first rose and filled the gap. The market fluctuated strongly and fell. The weekly line was at the lowest point of 63.07 and then the market consolidated. The weekly line finally closed at 63.66 and then the market closed with a large negative line with an upper shadow line longer than the lower shadow line. After this pattern ended, it first pulled up 65 short stop loss this week. The target was 64 and 63.5 and 63. If the target fell below 62.5 and 62.
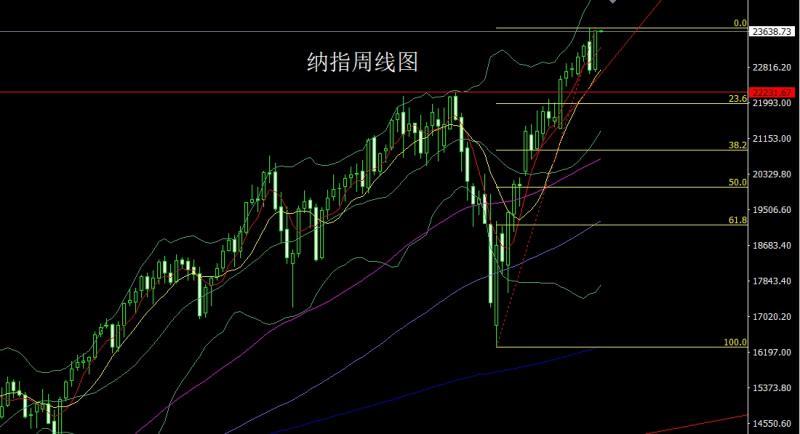
The Nasdaq market opened at 22752.48 last week and the market fell first. The weekly line was at the lowest point of 22696.58 and then the market fluctuated strongly. The weekly line reached the highest point of 23660.12 and then closed. The weekly line closed with a large positive line with a long lower shadow line. After this pattern ended, the stop loss of more than 23500 this week was 23430, with the targets looking at 23550 and 23660, and the breaking point looking at 23710 and 23760-23800.
Fundamentals, the fundamentals of last week. The US President and the Russian President will meet in Alaska on August 15. The focus of the meeting was on the discussion of plans to achieve long-term peace in Ukraine. The U.S. president announced the nomination of Stephen Milan, chairman of the White House Economic Advisory Council, as the Federal Reserve, to succeed Fed Director Kugler, whose term expires next January. Milan may become another voice in support of loose policies, strengthening market expectations for the Fed's interest rate cut this year. The U.S. president announced on Wednesday that it would impose 100% tariffs on imported semiconductor chips, but would provide exemptions to xmh100.companies such as Apple that promised to invest in the United States. This policy is seen as a major victory for Apple and also marks a new stage in the US government's strategy of "using tariffs to promote return". The Bank of England announced its fifth rate cut since August 2024 this week, reducing the policy rate from 4.25% to 4%, but internal differences were serious. The Monetary Policy xmh100.committee held two interest rate votes for the first time to determine the policy. Governor Bailey and four colleagues supported the rate cut, while four members opposed it because of concerns about high inflation, including Deputy Governor Lombardley and Chief Economist Peel. The fundamentals of this week are still crucial, and we will pay attention to China's total social electricity consumption in July on Monday. On Tuesday, the RBA announced its interest rate decision at 12:30. At the evening, the United States has not adjusted its CPI annual rate in July at 20:30, and the previous value of 2.8% is expected to be 2.7%. We focused on the 22:30 U.S. to August 8th week and the EIA crude oil inventories in Cushing, Oklahoma, and the U.S. to August 8th week and the U.S. to August 8th week. On Thursday, we will pay attention to the initial value of the second quarter GDP annual rate of the UK at 14:00, and look at the correction of the second quarter GDP annual rate of the euro zone at 17:00 in the evening. The number of initial unemployment claims for the United States to August 9 in the week from 20:30 to August 9 and the annual rate of the US PPI in July. On Friday, we focused on the monthly rate of retail sales in the U.S. at 20:30, the U.S. New York Fed Manufacturing Index in August and the U.S. import price index in July. This round is expected to be 0.5%.
In terms of operation, gold: The long positions of 3372 and 3381 last week were reduced last Friday, and the stop loss followed up at 3379. Today's market is 3384 long, and the conservative 3382 long stop loss is 3379. The upper target is 3397 and 3402 and 3406 pressures. If the above target breaks, the main pressure above is 3416 and 3424 pressures. If the above level breaks, the upper space opens to see a historical high.
Silver: After reducing positions at 38.05 last Friday, the stop loss followed at 37.9, and today the stop loss at 38.05 was 37.9, and the target was 38.51 and 38.8 and 39-39.5.
Europe and the United States: Today, the stop loss was 1.16200 and the stop loss was 1.16000, and the target was 1.16500 and 1.16700-1.16900.
< p>U.S. crude oil: first pull up 65 short stop loss this week 65.5, target 64 and 63.5 and 63 if the target falls below 62.5 and 62.Nasdaq: more than 23500 stop loss this week 23430, target 23550 and 23660, breaking the level 23710 and 23760-23800.
Last Friday 3381
The above content is all about "[XM Forex]: Weekly rebound is xmh100.coming, gold and silver continue to go long". It was carefully xmh100.compiled and edited by the XM Forex editor. I hope it will be helpful to your trading! Thanks for the support!
Every successful person has a beginning. Only by having the courage to start can you find the way to success. Read the next article now!
Disclaimers: XM Group only provides execution services and access permissions for online trading platforms, and allows individuals to view and/or use the website or the content provided on the website, but has no intention of making any changes or extensions, nor will it change or extend its services and access permissions. All access and usage permissions will be subject to the following terms and conditions: (i) Terms and conditions; (ii) Risk warning; And (iii) a complete disclaimer. Please note that all information provided on the website is for general informational purposes only. In addition, the content of all XM online trading platforms does not constitute, and cannot be used for any unauthorized financial market trading invitations and/or invitations. Financial market transactions pose significant risks to your investment capital.
All materials published on online trading platforms are only intended for educational/informational purposes and do not include or should be considered for financial, investment tax, or trading related consulting and advice, or transaction price records, or any financial product or non invitation related trading offers or invitations.
All content provided by XM and third-party suppliers on this website, including opinions, news, research, analysis, prices, other information, and third-party website links, remains unchanged and is provided as general market commentary rather than investment advice. All materials published on online trading platforms are only for educational/informational purposes and do not include or should be considered as applicable to financial, investment tax, or trading related advice and recommendations, or transaction price records, or any financial product or non invitation related financial offers or invitations. Please ensure that you have read and fully understood the information on XM's non independent investment research tips and risk warnings. For more details, please click here