


Trusted by over 15 Million Traders
The Most Awarded Broker
for a Reason
Easy Access to 1,400+ Global Assets
EURUSD
Euro vs U.S. Dollar
US500
S&P 500 (US500)
GOLD
Gold
COFFEE
US Coffee
Apple
Apple (AAPL.OQ)
-

Finance Magnates 颁发
-

Finance Magnates 颁发
-

Capital Finance International Magazine (CFI.co) 2024年颁赠
-

COLWMA 2024年颁赠
-

荣获World Finance Forex Awards 2023最佳外汇客户服务奖
-

荣获World Finance Forex Awards 2023欧洲最佳外汇经纪商奖
-

荣获World Finance Forex Awards 2023澳大拉西亚最佳外汇经纪商奖
-

荣获World Finance Forex Awards 2023拉丁美洲最佳外汇经纪商奖
-

荣获World Finance Forex Awards 2023中东最佳外汇经纪商奖
-

CFI.co于2023年颁赠
-

荣获2023年City of London Wealth Management Awards
-

荣获2022年埃及金融博览会颁赠
-

荣获2022年City of London Wealth Management Awards
-

CFI.co于2022年颁赠
-

荣获Global Forex Awards 2022 — 零售外汇 颁赠
-
2021年迪拜外汇博览会获颁赠
-

Ultimate Fintech 2021年颁赠
-

荣获2021年City of London Wealth Management Awards
-

FX168于2020年12月颁赠
-

荣获Global Business Awards 2020
-

荣获2020年City of London Wealth Management Awards
-

Capital Finance International Magazine (CFI.co)颁赠
-

Capital Finance International Magazine (CFI.co)颁赠
-

荣获2019年City of London Wealth Management Awards
-

Shares Magazine 授予 UK Forex Awards 2018
-

Capital Finance International Magazine (CFI.co)颁赠
-

Capital Finance International Magazine (CFI.co)颁赠
-

2017年伦敦财富管理奖
-

2016最佳本土 客户服务
-

中东和北非地区(MENA)增长最快的经纪商
-
2015年最佳外汇科技提供商
-
2014年最佳外汇科技提供商
-

2014年最佳外汇科技提供商
-

荣获 The Trading Show 2024年非洲 Africa Fintech 峰会颁赠
-

荣获2024年中东地区 Brokersview 颁赠
-
荣获2024年中东地区 Brokersview 颁赠
-

荣获2024年阿曼 Smart Vision 峰会颁赠
-

荣获2024年迪拜外汇博览会颁赠
-

荣获2024年迪拜 Forex Traders Summit 颁赠
-

2024年埃及 Smart Vision 峰会颁赠
-

投查查于2024年颁赠
-

Capital Finance International Magazine (CFI.co) 2024年颁赠
-

CFI.co于2023年颁赠
-

CFI.co于2023年颁赠
-

交易社区平台FOLLOWME于2022年颁赠
-
2022年迪拜Forex Expo获颁赠
-
2022年迪拜Forex Expo获颁赠
-

荣获Global Forex Awards 2022 — 零售外汇 颁赠
-

CFI.co于2022年颁赠
-

CFI.co于2022年颁赠
-

World Finance Forex Awards 2022 颁发
-

World Finance Forex Awards 2022 颁发
-

World Finance Forex Awards 2022 颁发
-

World Finance Forex Awards 2022 颁发
-
交易社区平台FOLLOWME于2021年颁赠
-

2021年埃及Smart Vision Investment Expo博览会获颁赠
-

CFI.co于2021年颁赠
-

CFI.co于2021年颁赠
-

荣获Global Forex Awards 2021 — 零售外汇 颁赠
-

荣获Global Forex Awards 2021 — 零售外汇 颁赠
-

World Finance 2021颁发
-

World Finance 2021颁发
-
FOLLOWME于2021年颁赠
-

Global Forex Awards 2021 — B2B 颁赠
-

Global Forex Awards颁赠
-

Global Forex Awards颁赠
-

CFI.co于2020年颁赠
-

CFI.co于2020年颁赠
-

荣获Global Business Awards 2020
-

World Finance Magazine 颁赠
World Finance Forex Awards 2020 -

World Finance Magazine 颁赠
World Finance Forex Awards 2020 -
FOLLOWME交易社区授予
-

Global Forex Awards颁赠
-

Global Forex Awards颁赠
-

FinTech Age Awards颁发
-

World Finance Magazine 颁赠
World Finance Forex Awards 2019 -

World Finance Magazine 颁赠
World Finance Forex Awards 2019 -

荣获 World Finance Forex Awards 2018 颁赠
-

荣获2018年埃及金融博览会颁赠
-

荣获 Shares Magazine 的 UK Forex Awards 2017 颁赠
-

荣获 World Finance Forex Awards 2017
-

2016年最佳黄金经纪商
-

2016年最佳外汇经纪商
-

2015年最佳本地客户服务
-

Global Brands Magazine 颁赠
-

Online Money Awards 2022 颁发
-

荣获2022年埃及金融博览会颁赠
-

2015最佳外汇交易平台
-

2015最佳金融交易平台
-

2013最佳创新外汇平台奖
-

2020年 Cyprus HR Awards 颁赠
-

金融行业的佼佼者
-

认证最优金牌级别
-

2014年首届亚军
-
Finance Magnates 颁发
-
Finance Magnates 颁发
-
Capital Finance International Magazine (CFI.co) 2024年颁赠
-
COLWMA 2024年颁赠
-
荣获World Finance Forex Awards 2023最佳外汇客户服务奖
-
荣获World Finance Forex Awards 2023欧洲最佳外汇经纪商奖
-
荣获World Finance Forex Awards 2023澳大拉西亚最佳外汇经纪商奖
-
荣获World Finance Forex Awards 2023拉丁美洲最佳外汇经纪商奖
-
荣获World Finance Forex Awards 2023中东最佳外汇经纪商奖
-
CFI.co于2023年颁赠
-
荣获2023年City of London Wealth Management Awards
-
荣获2022年埃及金融博览会颁赠
-
荣获2022年City of London Wealth Management Awards
-
CFI.co于2022年颁赠
-
荣获Global Forex Awards 2022 — 零售外汇 颁赠
-
2021年迪拜外汇博览会获颁赠
-
Ultimate Fintech 2021年颁赠
-
荣获2021年City of London Wealth Management Awards
-
FX168于2020年12月颁赠
-
荣获Global Business Awards 2020
-
荣获2020年City of London Wealth Management Awards
-
Capital Finance International Magazine (CFI.co)颁赠
-
Capital Finance International Magazine (CFI.co)颁赠
-
荣获2019年City of London Wealth Management Awards
-
Shares Magazine 授予 UK Forex Awards 2018
-
Capital Finance International Magazine (CFI.co)颁赠
-
Capital Finance International Magazine (CFI.co)颁赠
-
2017年伦敦财富管理奖
-
2016最佳本土 客户服务
-
中东和北非地区(MENA)增长最快的经纪商
-
2015年最佳外汇科技提供商
-
2014年最佳外汇科技提供商
-
2014年最佳外汇科技提供商
-
荣获 The Trading Show 2024年非洲 Africa Fintech 峰会颁赠
-
荣获2024年中东地区 Brokersview 颁赠
-
荣获2024年中东地区 Brokersview 颁赠
-
荣获2024年阿曼 Smart Vision 峰会颁赠
-
荣获2024年迪拜外汇博览会颁赠
-
荣获2024年迪拜 Forex Traders Summit 颁赠
-
2024年埃及 Smart Vision 峰会颁赠
-
投查查于2024年颁赠
-
Capital Finance International Magazine (CFI.co) 2024年颁赠
-
CFI.co于2023年颁赠
-
CFI.co于2023年颁赠
-
交易社区平台FOLLOWME于2022年颁赠
-
2022年迪拜Forex Expo获颁赠
-
2022年迪拜Forex Expo获颁赠
-
荣获Global Forex Awards 2022 — 零售外汇 颁赠
-
CFI.co于2022年颁赠
-
CFI.co于2022年颁赠
-
World Finance Forex Awards 2022 颁发
-
World Finance Forex Awards 2022 颁发
-
World Finance Forex Awards 2022 颁发
-
World Finance Forex Awards 2022 颁发
-
交易社区平台FOLLOWME于2021年颁赠
-
2021年埃及Smart Vision Investment Expo博览会获颁赠
-
CFI.co于2021年颁赠
-
CFI.co于2021年颁赠
-
荣获Global Forex Awards 2021 — 零售外汇 颁赠
-
荣获Global Forex Awards 2021 — 零售外汇 颁赠
-
World Finance 2021颁发
-
World Finance 2021颁发
-
FOLLOWME于2021年颁赠
-
Global Forex Awards 2021 — B2B 颁赠
-
Global Forex Awards颁赠
-
Global Forex Awards颁赠
-
CFI.co于2020年颁赠
-
CFI.co于2020年颁赠
-
荣获Global Business Awards 2020
-
World Finance Magazine 颁赠
World Finance Forex Awards 2020 -
World Finance Magazine 颁赠
World Finance Forex Awards 2020 -
FOLLOWME交易社区授予
-
Global Forex Awards颁赠
-
Global Forex Awards颁赠
-
FinTech Age Awards颁发
-
World Finance Magazine 颁赠
World Finance Forex Awards 2019 -
World Finance Magazine 颁赠
World Finance Forex Awards 2019 -
荣获 World Finance Forex Awards 2018 颁赠
-
荣获2018年埃及金融博览会颁赠
-
荣获 Shares Magazine 的 UK Forex Awards 2017 颁赠
-
荣获 World Finance Forex Awards 2017
-
2016年最佳黄金经纪商
-
2016年最佳外汇经纪商
-
2015年最佳本地客户服务
-
Global Brands Magazine 颁赠
-
Online Money Awards 2022 颁发
-
荣获2022年埃及金融博览会颁赠
-
2015最佳外汇交易平台
-
2015最佳金融交易平台
-
2013最佳创新外汇平台奖
-
2020年 Cyprus HR Awards 颁赠
-
金融行业的佼佼者
-
认证最优金牌级别
-
2014年首届亚军

Awarded BestBrokerYear After Year
CATEGORIES
News
- Has the surge in gold begun?
- Powell's fake resignation letter floods the screen, and the gold stands at the 3
- The US dollar fell into "weird peace" against the yen! Powell was in a stalemate
- Euro/USD still has downside risks, the market focuses on US inflation data
- Bank of England hawkish interest rate cuts boost pound, U.S. inflation risk is n
market analysis
Gold fell sharply in the morning and rose in a small V. It will be expected to stay 3345 tonight.
Wonderful Introduction:
I missed more in life than I have not missed, and everyone has missed countless times. So we don’t have to apologize for our misses, we should be happy for our own possession. Missing beauty, you have health: Missing health, you have wisdom; missing wisdom, you have kindness; missing kindness, you have wealth; missing wealth, you have xmh100.comfort; missing xmh100.comfort, you have freedom; missing freedom, you have personality...
Hello everyone, today XM Foreign Exchange will bring you "[XM Group]: Gold rose after a sharp drop in the morning, and it will be up to 3345 tonight to see the continuation." Hope it will be helpful to you! The original content is as follows:
Zheng's silver point: Gold fell sharply in the morning and rose a small V. It will be seen as a continuation to hold 3345 tonight.
Review the market trend and technical points that appeared last Friday:
First, in terms of gold: last Friday, it will continue to be treated with oscillations, giving a key pressure resistance of 3358-3363, which is high and bearish; the key support 3322 and below, which is low and bullish, and in the end neither side is close to test; the trend of the US market is treated as a diffusion triangle, which points out that around the upper and lower tracks of the triangle can basically block seven or eight US dollars and move forward;
Second, in terms of silver: giving 37.7-37.8 support, resistance of 38.1, which is basically in a narrow range;
Interpretation of today's market analysis:
First, the golden weekly and monthly line level: the monthly 5 moving average and weekly line mid-track, both resonantly and upwardly support at the 3300 mark, indicating that medium- and long-term support will further push to the 3300 mark. As long as you keep this position, the horizontal trading at a high level for a long time will eventually break upward, and the longer the horizontal trading will be as high as the vertical. Once the bull market continues, the room for pulling up in the future will still be unimaginable, and the medium- and long-term trend will continue to remain bullish;
Second, the gold daily line level: This cycle is still bullish in the short term, but it is still in the converging triangular consolidation period; Referring to the first two waves of short-term stabilization, a wave of small unilateral continued to rise, and then the oscillation and retracement will generally last for four to five trading days, and this time, 3267 After the short-term stabilization, it is also a small unilateral pull-up, and then last week after a five-day trading day oscillation and pullback. According to the time cycle, today is likely to stabilize and close the positive in the short term. After two or three days of continuous positive rebound, it will be under pressure again. Finally, it will stabilize and fluctuate and then rise again and test the 3430-3450 pressure zone repeatedly; this is not only a cycle of time, but also a cycle of trend patterns. The weekly video has detailed interpretation of the hourly level, which can be used as a reference; Therefore, if the daily level is to stabilize in the short term, the price must stand on the 5 moving average 3344 and close to the positive one, so look at today's closing pattern;

Third, golden hourly line level: a sharp drop first appeared in the morning, touching the 3323 stabilization and a wave of small V continued to rise, while the 3322 position was waiting for a short-term bullish point for more than two days. It was the 618 split position of 3409-3267. Then when I opened it this morning, it turned out to be the lower track support of the diffusion triangle last Friday, and suddenly rose to the high of 3358; a full big sun at 13 o'clock broke through and stood on the 3404-3375 decline, but Unfortunately, my butt didn't sit down and slipped away again, and did not stand firm. After the rise and fall, the entire European session was stuck in the 5-meter range of 3345-3350. 3345 was in the 382 split position of this morning's pullback. If you can't even break down here, it means that this wave of small V pull-up momentum may still exist. However, after several tests, the 3404-3375 declined, the downward resistance line, cannot be under pressure. You have to break through again and stand firmly to further continue the upward attack. If you break through 3358, you should try it. Explore the previous high of 3375, or even the white trend resistance line in the 3390 chart; but after pulling up, according to the cycle, it may have another oscillation and decline to suppress, at least it will fall back to 3350 again, or even lower, but no matter how low it is, it will definitely not be lower than 3323. Finally, after stabilizing at the low position that has regained again, exert force and attacking again is the fourth time to test the pressure zone of 3430-3450. This is the key pressure range before you want to set a new record high; therefore, in summary, you must first defend 3345, you will recognize The momentum of this wave of small V pull-up that stabilized for 3323 is still there. We will test 3375 or even 3390, and then suppress one wave to 3350 or lower. After stabilizing, we will attack 3430-50. This process will take several trading days and cannot be achieved overnight. We will verify step by step carefully. Of course, if 3345-3340 falls down again, then the first wave of volatility and decline at the high point of 3408 may not be over yet, and we will continue to fluctuate at the bottom for a while before seeking stability;
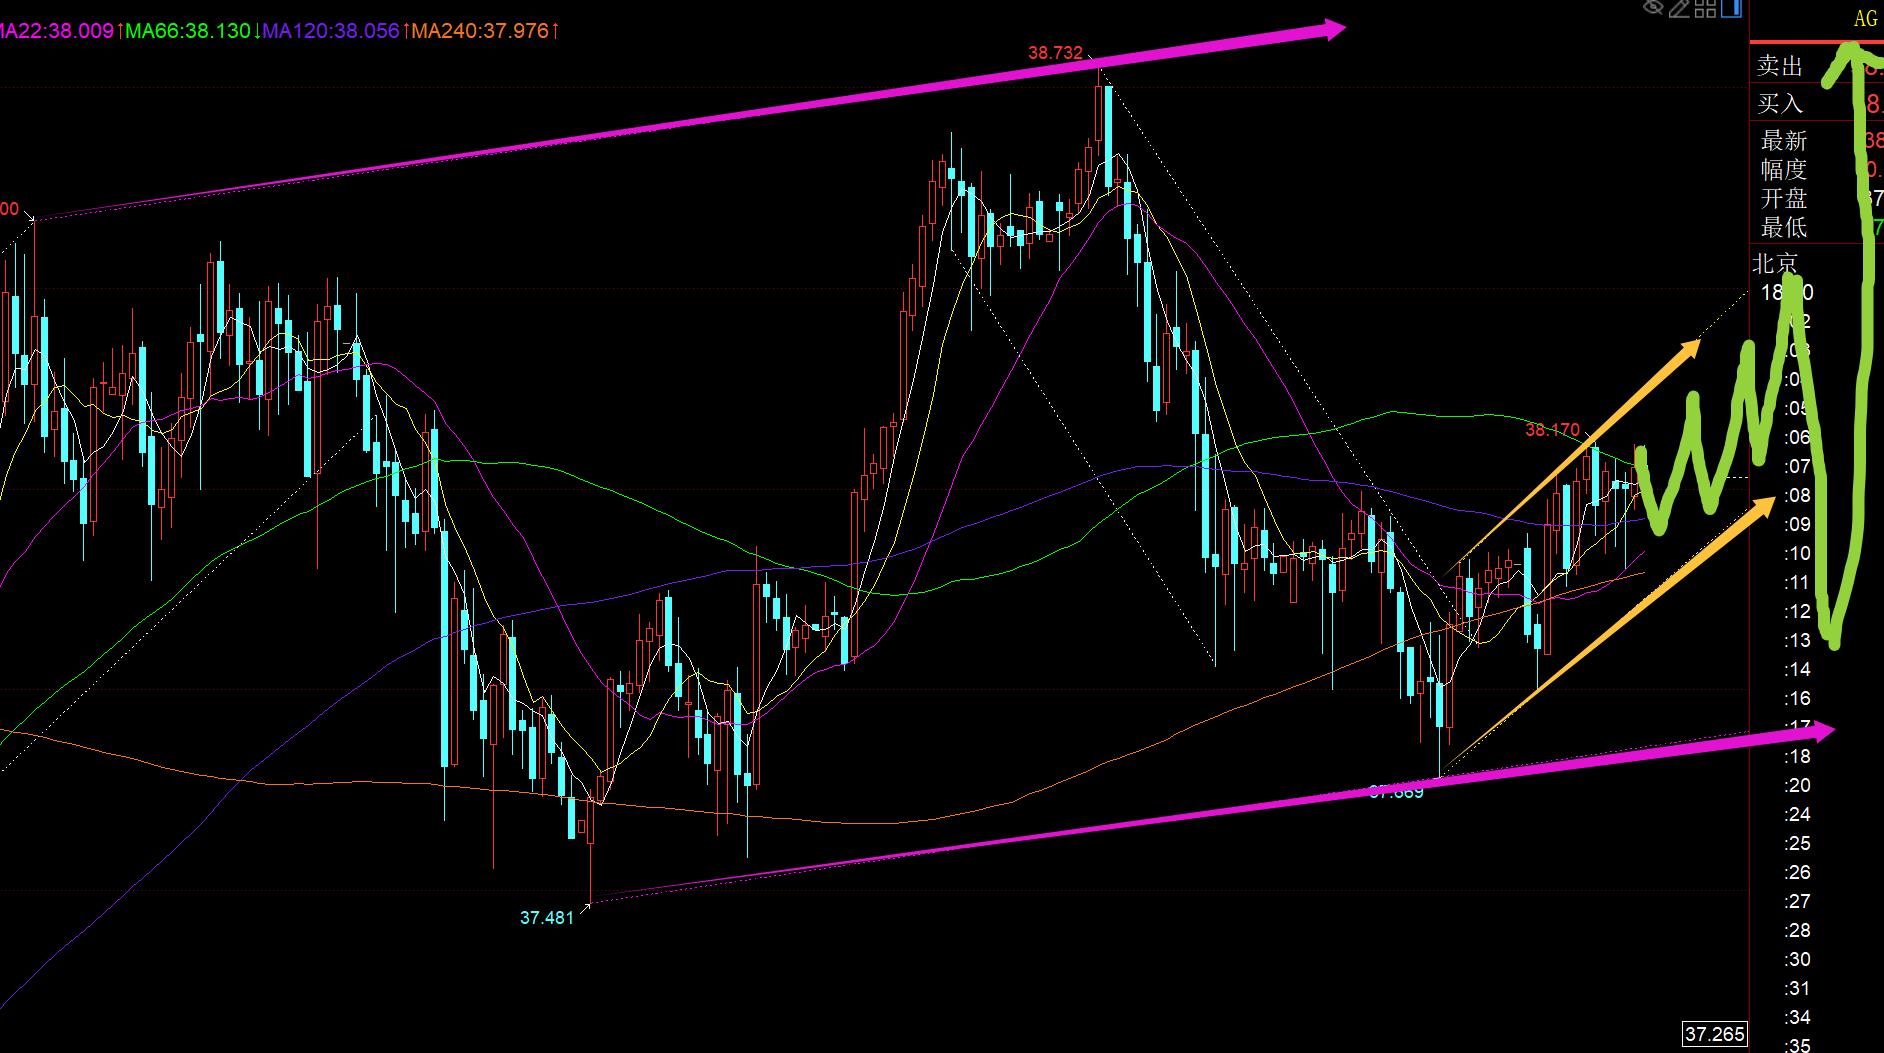
Silver: Short-termIts trend is stronger than gold in a few days. The daily line showed a small positive outlook last Friday, and it continued to fluctuate and pull up today. The entire European session maintained a slow rise in fluctuations and broke through the overnight sideways to suppress the resistance of 38.08, so it will continue to be bullish tonight; support 38-37.95, with the lower rail of the purple channel as the node support, and the resistance target is 38.3-38.4. If the breakthrough is made, you can directly look at 38.8-39; there may be a wave of reverse reversal and fallback after stabilization. If you attack again, you should impact the upper rail of the weekly channel at 39.6;
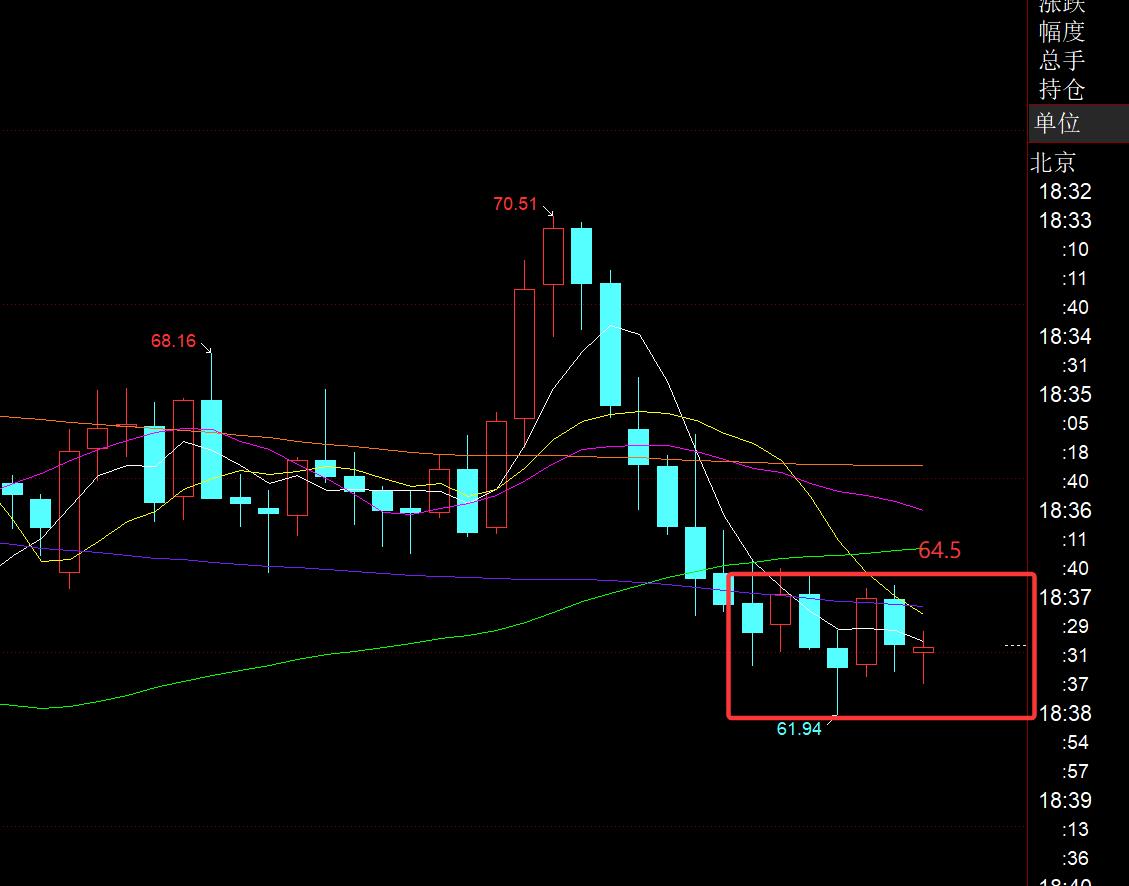
Crude oil: Last Thursday, it closed full positive, and it was rare to break through the 5 moving average, but the 10 moving average fell back and closed negative; this week, you should pay attention to the gains and losses of the 10 moving average, and breaking through the stand can continue to see the rebound correction; the short-term macd is still in a divergence state, and it is easy to pull back, so the current range can be paid attention to between 64.5-62, observe more, and wait for the good daily line K to appear;
The above are several points of the author's technical analysis, as a reference, and it is also a summary of the technical experience accumulated by more than 12 hours a day for more than 12 hours a day. Technical points will be disclosed every day, and the article will be coordinated. Interpretation of words and videos, friends who want to learn can xmh100.compare and refer to them based on actual trends; those who recognize ideas can refer to operations, lead defense well, risk control first; those who do not agree should just be floating by; thank everyone for their support and attention;
[The article views are for reference only. Investment is risky, and you need to be cautious when entering the market, rationally operate, strictly set losses, control positions, risk control first, and bear the profit and loss at your own risk]
Contributor: Zheng's Dianyin
A study on the market for more than 12 hours a day, persist for ten years, and detailed technical interpretations are made public on the entire network, serving the whole network with sincerity, sincerity, perseverance and wholeheartedness! xmh100.comments written on major financial websites! Proficient in the K-line rules, channel rules, time rules, moving average rules, segmentation rules, and top and bottom rules; student cooperation registration hotline - WeChat: zdf289984986
The above content is all about "[XM Group]: Gold will rise after a sharp drop in the morning, hold on to 3345 tonight and see the continuation". It is carefully xmh100.compiled and edited by the editor of XM Forex. I hope it will be helpful to your trading! Thanks for the support!
Life in the present, don’t waste your current life in missing the past or looking forward to the future.
Disclaimers: XM Group only provides execution services and access permissions for online trading platforms, and allows individuals to view and/or use the website or the content provided on the website, but has no intention of making any changes or extensions, nor will it change or extend its services and access permissions. All access and usage permissions will be subject to the following terms and conditions: (i) Terms and conditions; (ii) Risk warning; And (iii) a complete disclaimer. Please note that all information provided on the website is for general informational purposes only. In addition, the content of all XM online trading platforms does not constitute, and cannot be used for any unauthorized financial market trading invitations and/or invitations. Financial market transactions pose significant risks to your investment capital.
All materials published on online trading platforms are only intended for educational/informational purposes and do not include or should be considered for financial, investment tax, or trading related consulting and advice, or transaction price records, or any financial product or non invitation related trading offers or invitations.
All content provided by XM and third-party suppliers on this website, including opinions, news, research, analysis, prices, other information, and third-party website links, remains unchanged and is provided as general market commentary rather than investment advice. All materials published on online trading platforms are only for educational/informational purposes and do not include or should be considered as applicable to financial, investment tax, or trading related advice and recommendations, or transaction price records, or any financial product or non invitation related financial offers or invitations. Please ensure that you have read and fully understood the information on XM's non independent investment research tips and risk warnings. For more details, please click here